SARvision | Biologics | Sequence Alignment | Sequence Activity Relationships | Monomer Table
Analyzing Sequence Activity Relationships
by Mark Hansen, Ph.D.
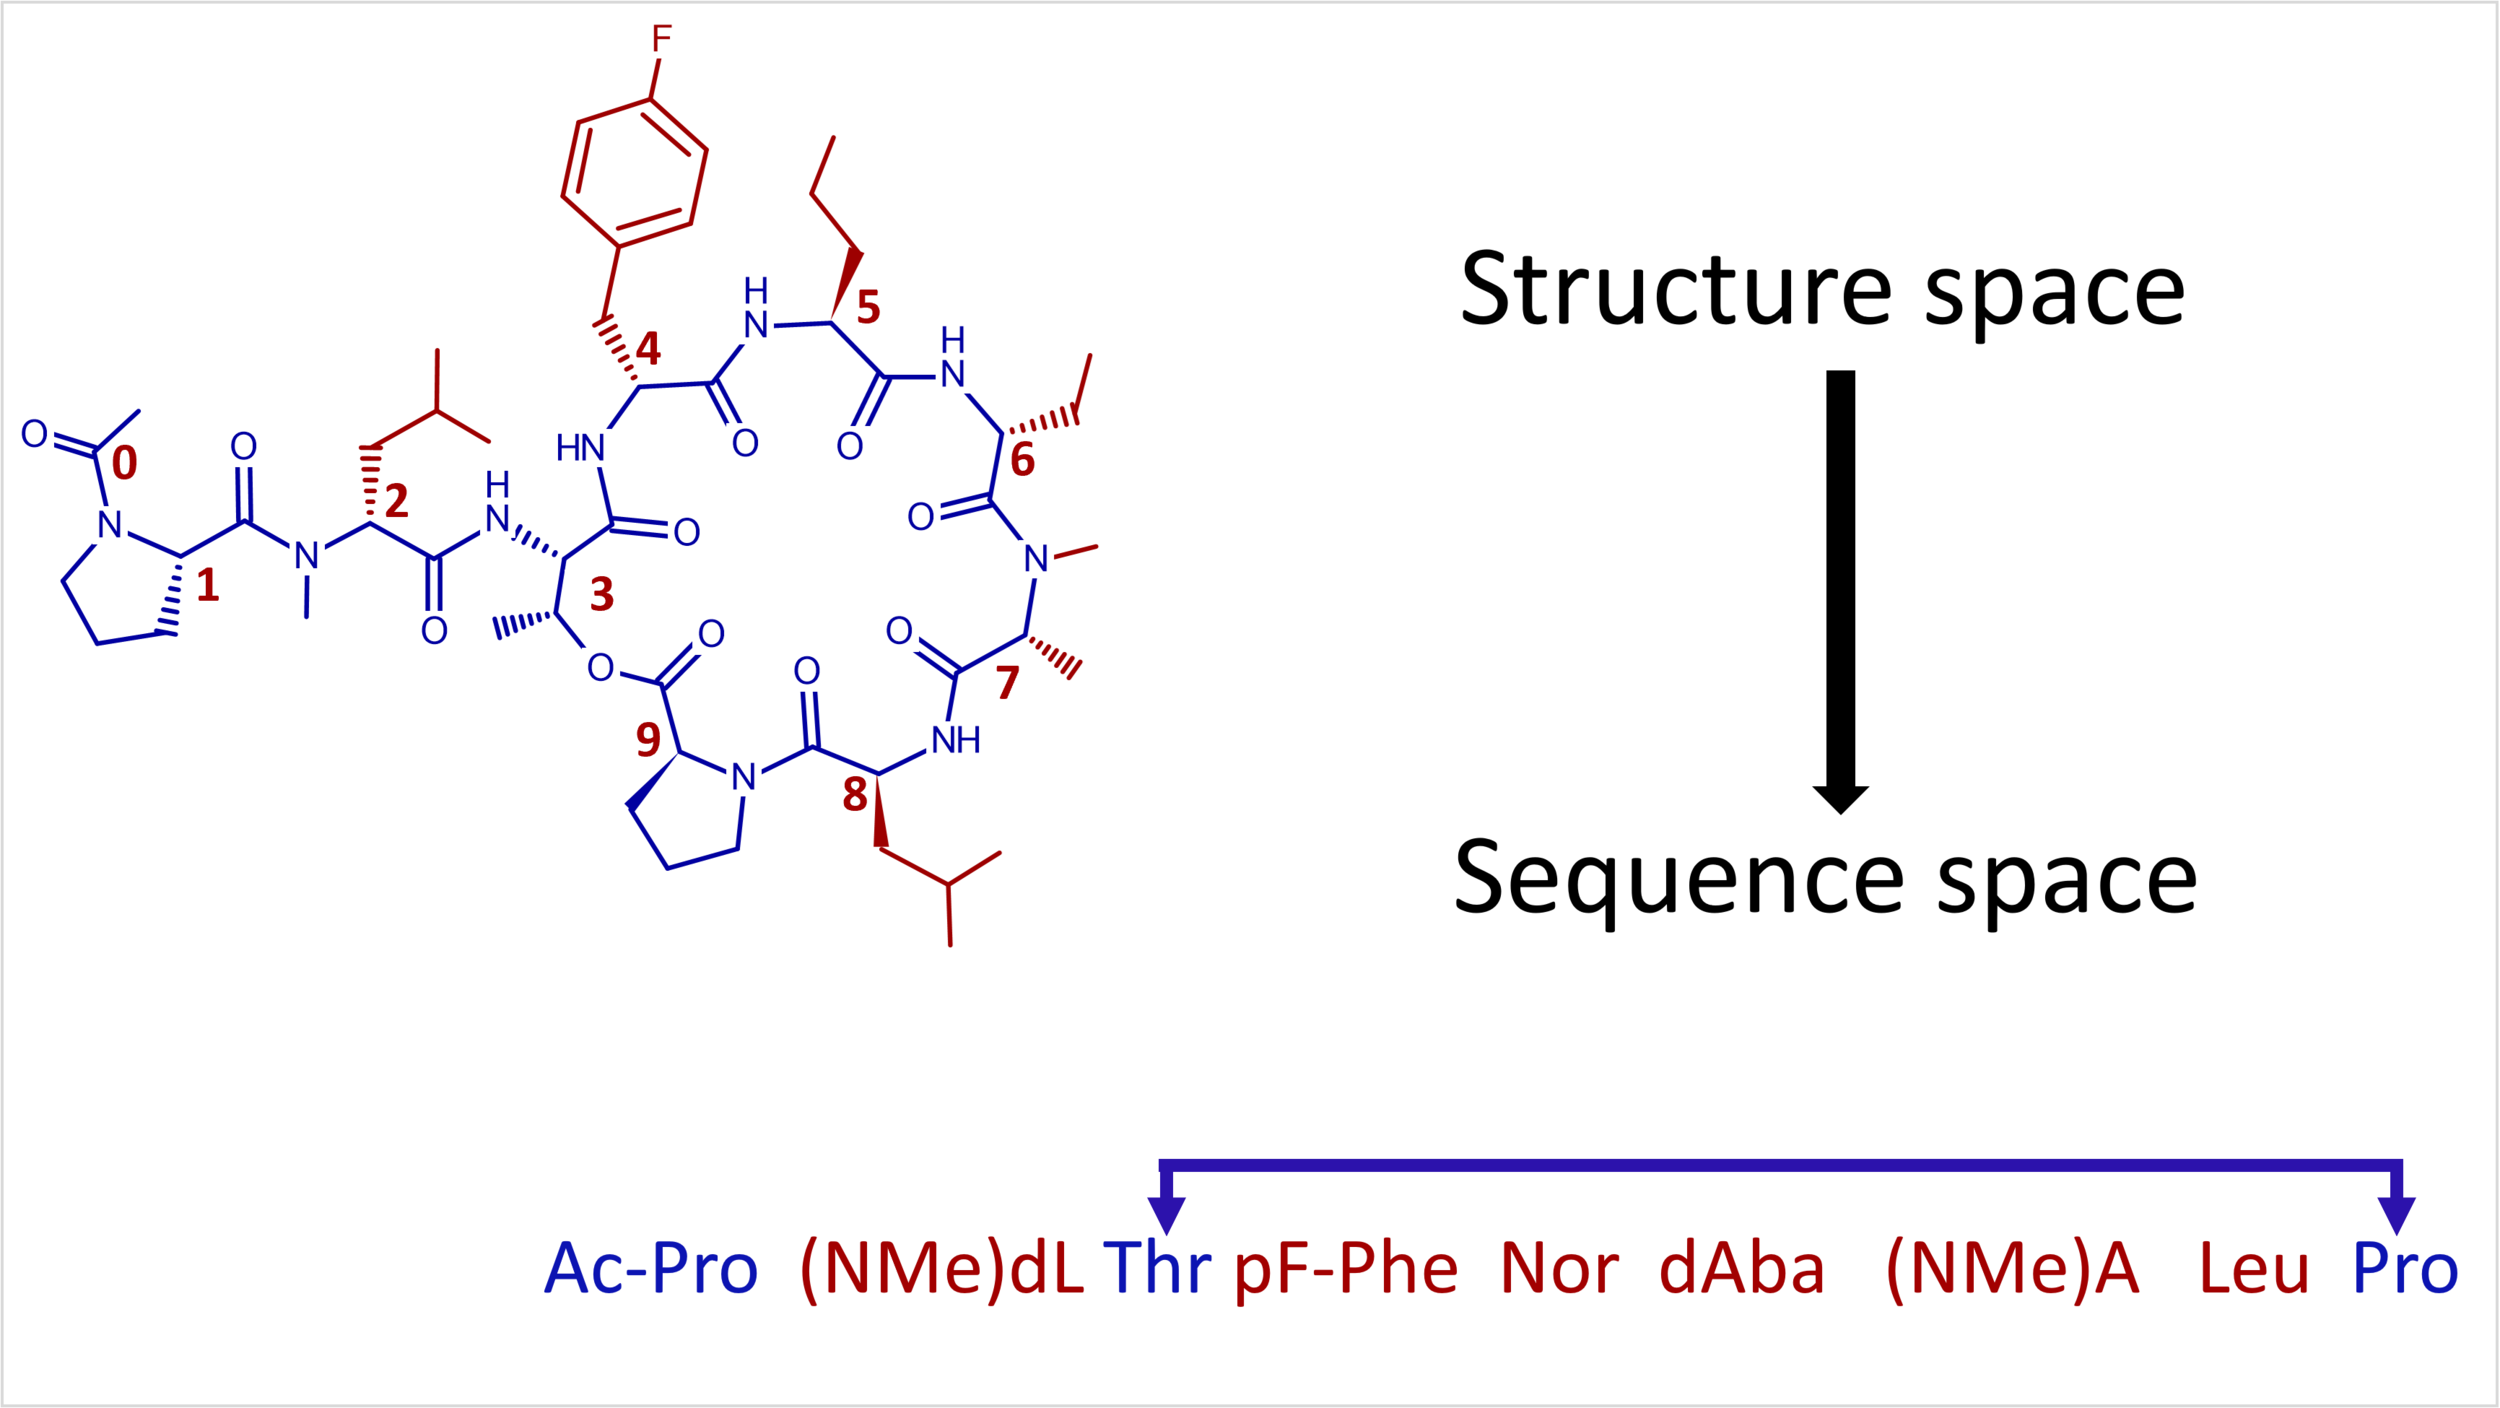
Sequence Activity Relationships are akin to Structure Activity Relationships except they are studied in sequence space.
Sequence Activity Relationships are analogous to Structure Activity Relationships in medicinal chemistry, except that they describe activity as a function of sequence. Because sequences are series of monomers with chemical structure (e.g. alanine, lysine….), one can argue that underlying difference is negligible; however analyzing activity in terms of sequences is a convenient tool to illuminate activity relationships. This relationship between sequence and activity for biologics such as antibodies, peptides and nucleic acids, can be difficult to decipher because analysis requires the integration three types of data and algorithms to align it properly. Sequences are a string of monomers that encode a biological entity that gets assayed to derive quantitative activity data that describes pharmacological function. These three data types are usually individually determined and stored and must be combined to create a complete, meaningful data set.
A sequence alignment table with activity data that can be used to study Sequence Activity Relationships.
Sequence data are arrays of monomers (sometimes referred to as residues), which must be arranged such that changes at a single position in the sequence can be related to changes in corresponding positions across all the sequences in a data-set. Sequences are aligned on rows in a matrix where each column corresponds to a single sequence position across the sequence set. Each column ideally correlates to a common position in 3D structure, a common site of interaction on a target and/or other common biologically / chemically relevant function. At the heart of understanding Sequence Activity Relationships is correlating changes in sequence columns with changes in activity data.
If chemists synthesize molecules based on a template, modifications are incorporated in a position specific manner where position alignment can be saved for each molecule. These sequences are considered pre-aligned. This is the ideal scenario in which alignment remains unambiguous and future work to align sequences is unnecessary. Alternatively, if this is not the case, alignment of the sequences can be performed using a variation of the Needleman-Wunsch algorithm. In this algorithm, gaps are inserted into each sequence to shift monomers to achieve an overall alignment such that each column contains monomers that maximizes overall global similarity for all columns. These gaps are represented with a dash or ‘-‘ in the alignment..
Columns in a sequence alignment correspond to positions on the 3D molecule that have functional significance to the activity of the compound.
The third and final component in the analysis is the inclusion of a monomer table into the analysis to render chemical meaning to each element in the sequence. The monomer structure appears in a mouse over in the sequence table or can be added directly to a table to show the monomer structure in each cell. While the monomer abbreviations are useful in sequence analysis, chemical structure can be essential to elucidate molecular interactions that may occur at each position in the sequence/structure. The monomer table contains structure, names and abbreviations, font and background coloring, category, sorting information and any numeric data that the user would find useful. These data control the display, highlight important features of the data-set and can be used perform advanced analysis using physico-chemical properties of monomers at each position. Ideally a monomer table is maintained across a research group or even the entire company to maintain continuity in naming across projects.
An example monomer table used to study Sequence Activity Relationships. Each row adds a dimension of data to a monomer in the sequence to facilitate pharmacological analysis.
Using SARvision|Biologics, sequences of biological entities, experimental data and the monomer table can be brought together create a cohesive data-set to study Sequence Activity Relationships. The program can read tabular data from file (Excel:*.csv), from Oracle and from CDDVault. The monomer table can similarly be stored locally as a file (excel *.csv file), or shared across a research groups on a CDDVault server or in an Oracle server.


