R-Group Table | R-Group Deconvolution | R-Group Analysis | Structure Activity Relationships | SARvision
Build R-Group Tables to Analyze Structure Activity Relationships
by Mark Hansen, Ph.D.
R-Group analysis video
R-Group tables are built around a scaffold or chemical core common to a group of molecules under study. This type of table displays molecules broken down by substitution patterns around the common chemical moiety. This allows for in depth analysis of Structure Activity Relationships (SAR) between chemical substituent patterns at each position with respect to different activities displayed by the molecules. Data can be derived from any experimental technique or even derived from in silico methods such as molecular docking.
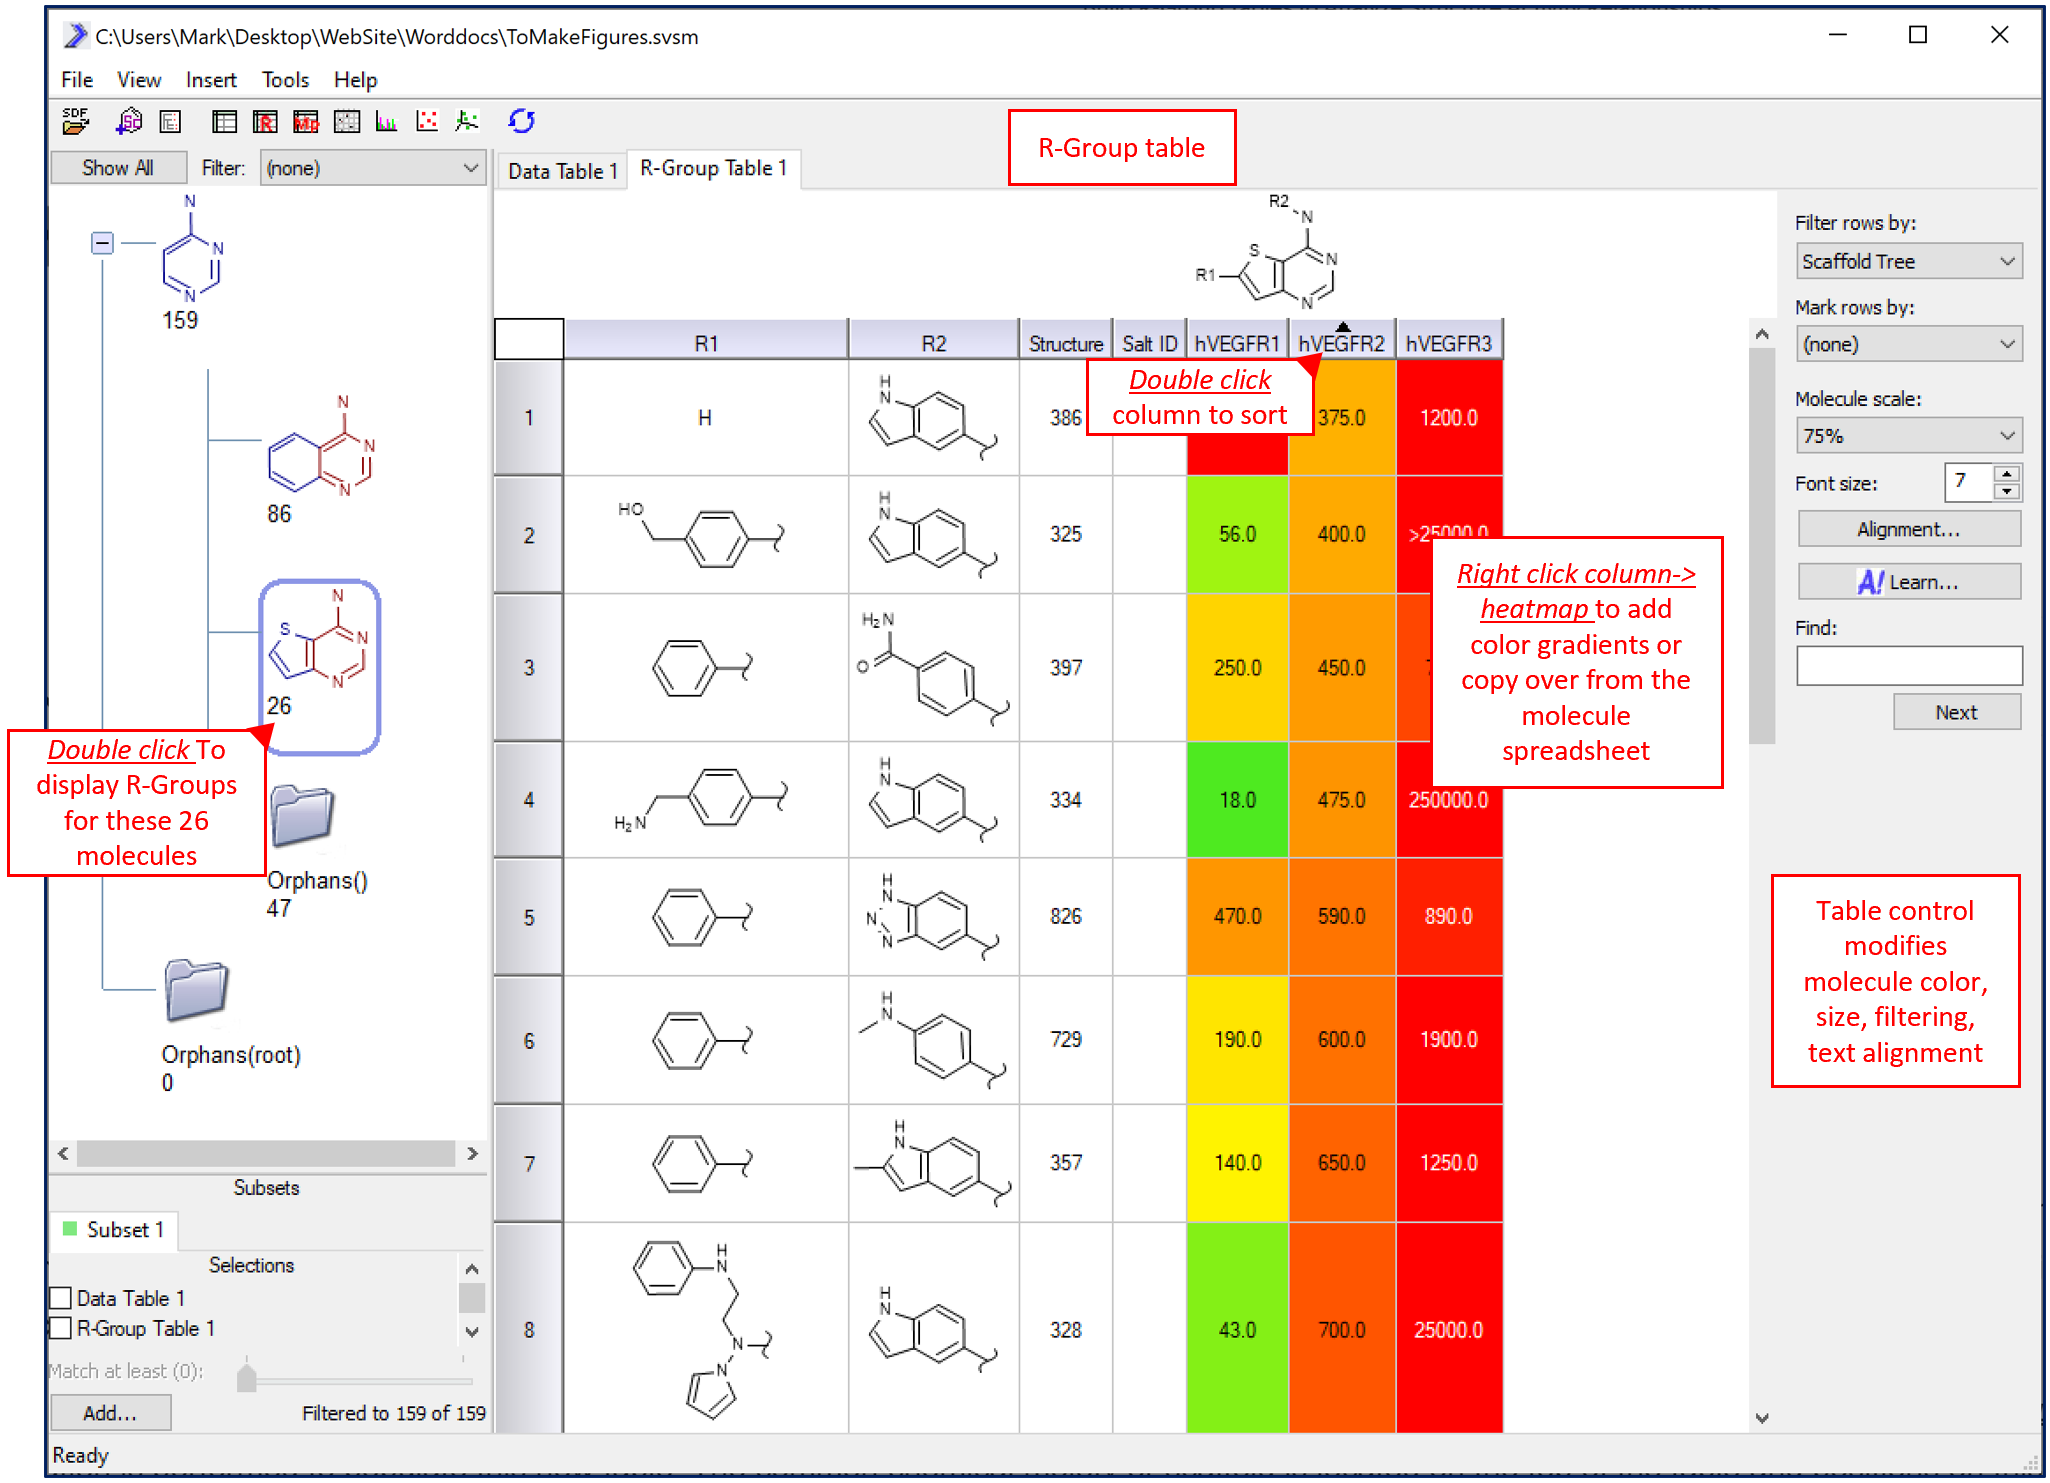
In SARvision, once a set of molecules has been loaded into a molecule spreadsheet, an R-Group table can be added under the main menu->Insert->R-Group table. By double-clicking on a scaffold in the scaffold pane, R-Group deconvolution is performed to populate this new table. The common chemical moiety or scaffold is located on the top of the table. Positions on this scaffold where the molecules in the set vary are sequentially numbered R1, R2….Rn. Under this scaffold are the columns labeled R1, R2,…Rn where the R-Groups or chemical fragments associated with each molecule are shown as rows in the table. Note that any wild card atoms on the scaffold (for example A~any atom, Q~any non carbon atom) create a Y column (Y1, Y2…) that will contain the element at that position. This table can be rapidly built and modified by changing the scaffold in the scaffold pane that is being selected (double clicked).
R-Group tables are built on demand by double clicking on any scaffold.
To optimize the table, columns can be hidden, heat-mapped and sorted. To sort a column double click the header to sort the rows from increasing or decreasing values. double clicking a column of R-Groups sorts the table by complexity of the R-Group. Alternatively, as an advanced option, R-Groups can be sorted based on their contribution to a machine learning model. To heat-map a column, right click on the column header and create coloring scheme in the popup UI. The applied coloring scheme can be stoplight and/or gradient in nature. Finally, to show/hide/change the order of the columns, right click on the R-Group table tab and select Columns option.
Predicted physico-chemical properties can be calculated for the R-Group columns to compare activity to properties. Under main menu->Tools->Calculate molecular properties, individual properties can be selected for calculation. Note that many of these are based on RDKIT models. These appear in the table and function as any other column in the R-Group table.
Note that these columns are created transiently in the R-Group table whenever a new scaffold is selected. The old columns are deleted and new ones created to match the current scaffold. To make one of the calculated R-Group property columns permanent and available in the other views, right click on the column header and select Copy data and give it a name.
There are a number of customizable cosmetic features to improve the look of the R-Group table. Any R-Group structure in the R-Group table can be substituted with a name (on R-Group: right click->rename). For example, instead of drawing a phenyl group, the user can instead name it “phenyl” to make a more compact table. Second, the user can rename (and reorder) R-Groups by simply re-drawing the scaffold (right click->edit) and adding R-Groups with numbers on them to the desired position on the scaffold in the Scaffold panel.
Lastly, similar to the Molecular spreadsheet, tables can be exported by right clicking on the R-Group table tab and selecting Export. Using this, a report in Excel or Word can be easily created.
